 1:31:21
 What Is R?
R Programming Language
R is a programming language designed specifically for statistical computing and data visualization. It excels in academic research, biostatistics, and data analysis with built-in statistical functions and the ggplot2 visualization library. R runs in RStudio IDE.
How R Works
R's strengths: statistical analysis, data visualization (ggplot2 is unmatched), and the tidyverse ecosystem (dplyr, tidyr, purrr) for data manipulation. It has more statistical packages than any other language. If you're doing serious statistical research, R is hard to beat.
Key Concepts
- tidyverse — A collection of R packages (dplyr, ggplot2, tidyr) for consistent, readable data analysis workflows
- ggplot2 — The most powerful data visualization library in any language — grammar of graphics approach
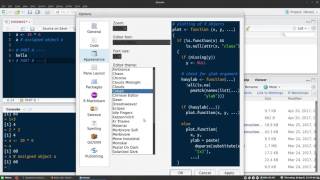
- RStudio — The primary IDE for R — combines editor, console, plots, and package management
Learn R — Top Videos
1:31:21 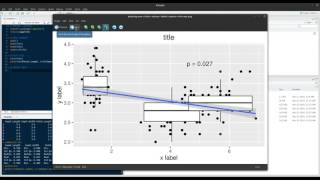 1:17:25
 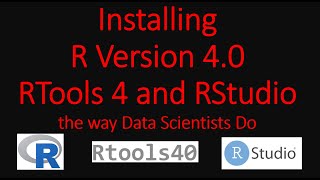 13:12
13:12 Installing R version 4.0 + RTools 4.0 + RStudio For Data Science (#R #RTools #RStudio #DataScience) iAnalyticsGeek
75.5K views · 1.8K likes · 5 years ago
R Educators

MarinStatsLectures-R Programming & Statistics
@marinstatlectures
Data Science
These R Programming and Statistics tutorials are originally created for Master's and PhD students at UBC by Professor Mi...
168K Subs
256 Videos
12.4K Avg Views
1.17% Engagement

R Programming 101
@rprogramming101
AI Coding
This channel provides teaching videos on data analysis and statistical analysis using R programming. The teaching videos...
144K Subs
238 Videos
3.4K Avg Views
2.28% Engagement

Dr. Bharatendra Rai
@bkrai
Data Science
University of Massachusetts Dartmouth, Professor & Chair | Harvard University, Adjunct Professor | R programming, ML, A...
50.1K Subs
397 Videos
525 Avg Views
4% Engagement
Frequently Asked Questions
Should I learn R or Python?
Python for general-purpose programming and ML. R for statistical analysis and academic research. Python has a broader ecosystem; R has deeper statistical packages. Many data scientists know both.
Is R used in industry?
Yes, but less than Python. R is common in pharma, biotech, academia, and finance for statistical analysis. Python dominates in tech companies and ML engineering.
Want a structured learning path?
Plan a R Lesson →